In 2018, I wanted to create a long-form infographic similar to those found online and in magazines. At the same time, I wanted to refresh my knowledge of HTML, CSS, and Javascript, which I hadn’t used since college, and learn how to create interactive web maps and graphs using R.
I think I bit off more than I could chew, and the project ended up taking much longer than I anticipated. Still, I’m proud that I could teach myself these skills during my breaks at work.
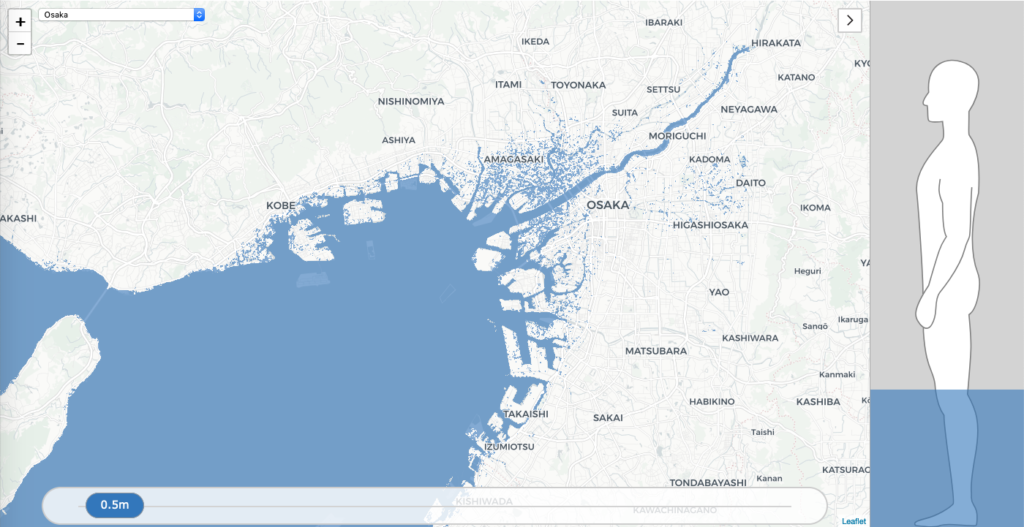
Throughout the project, I used a variety of tools, including HTML, CSS, Javascript, Leaflet.js, ggplot, and Illustrator.