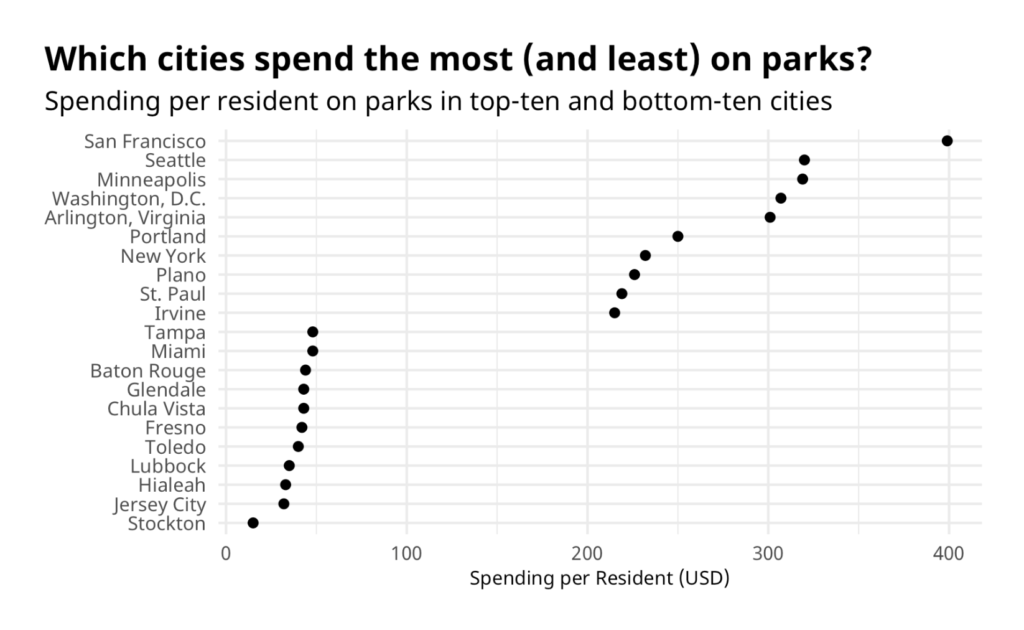
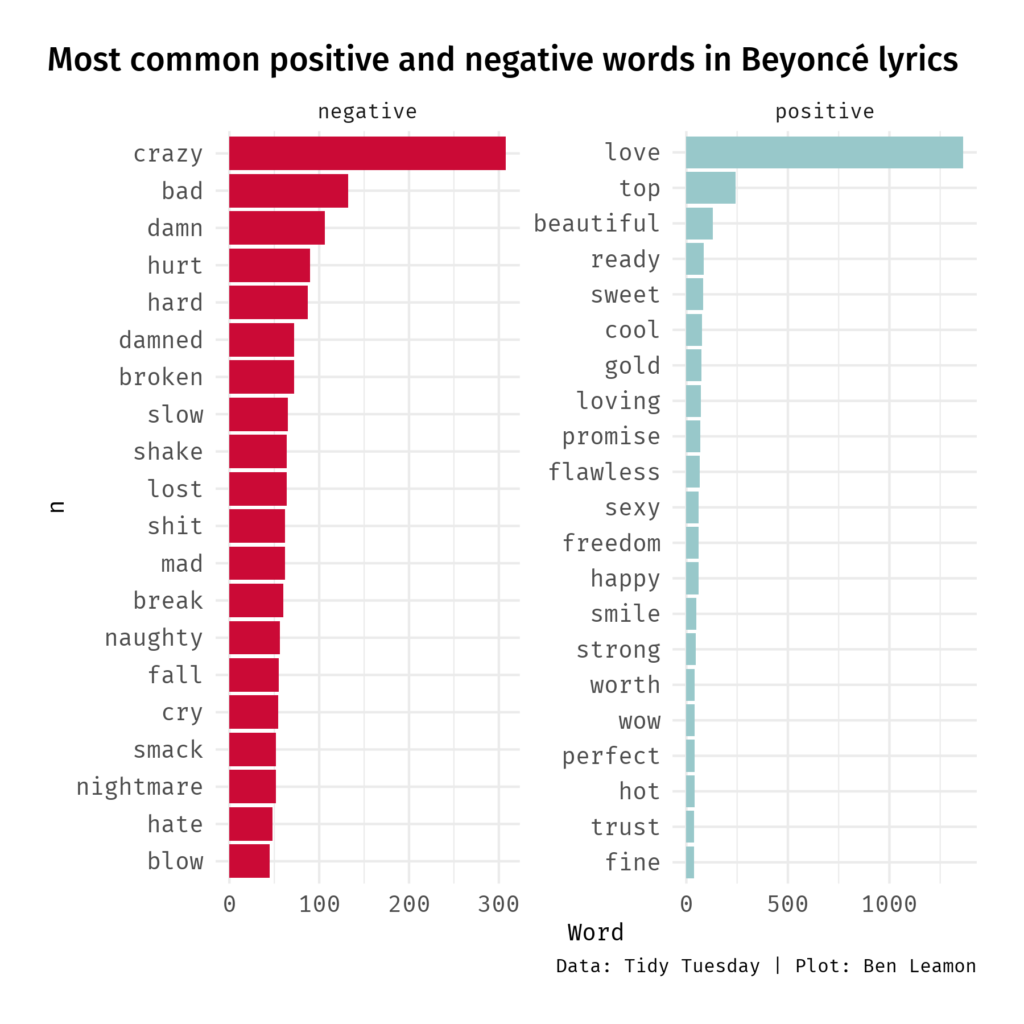
To continue practicing and improving my R and ggplot programming skills, I occasionally contribute to the Tidy Tuesday programming challenge. If you’d like to see the graphs, or check out the accompanying code, feel free to check it out on GitHub.
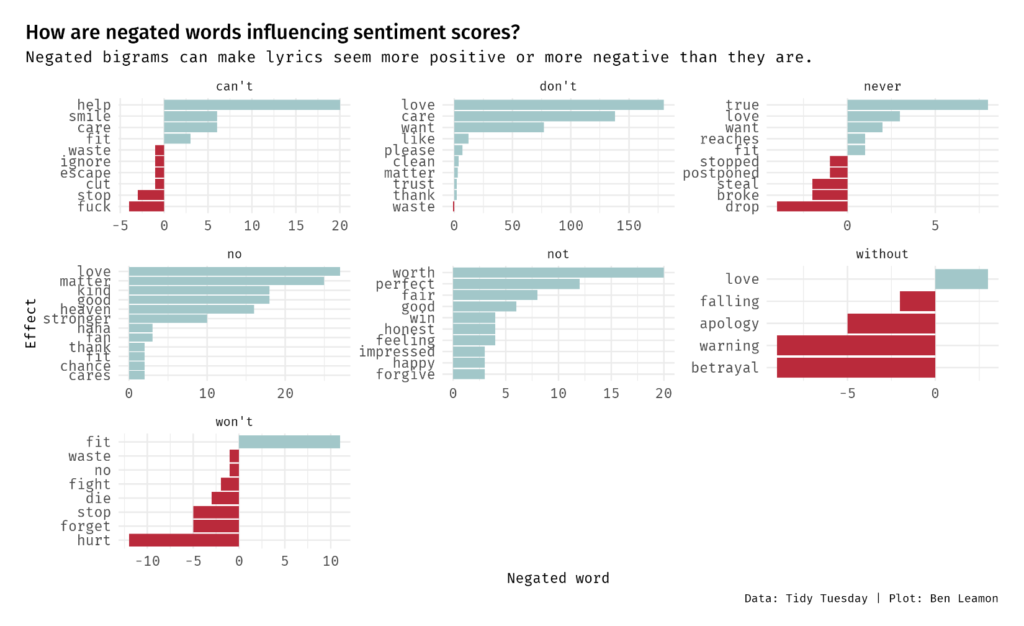
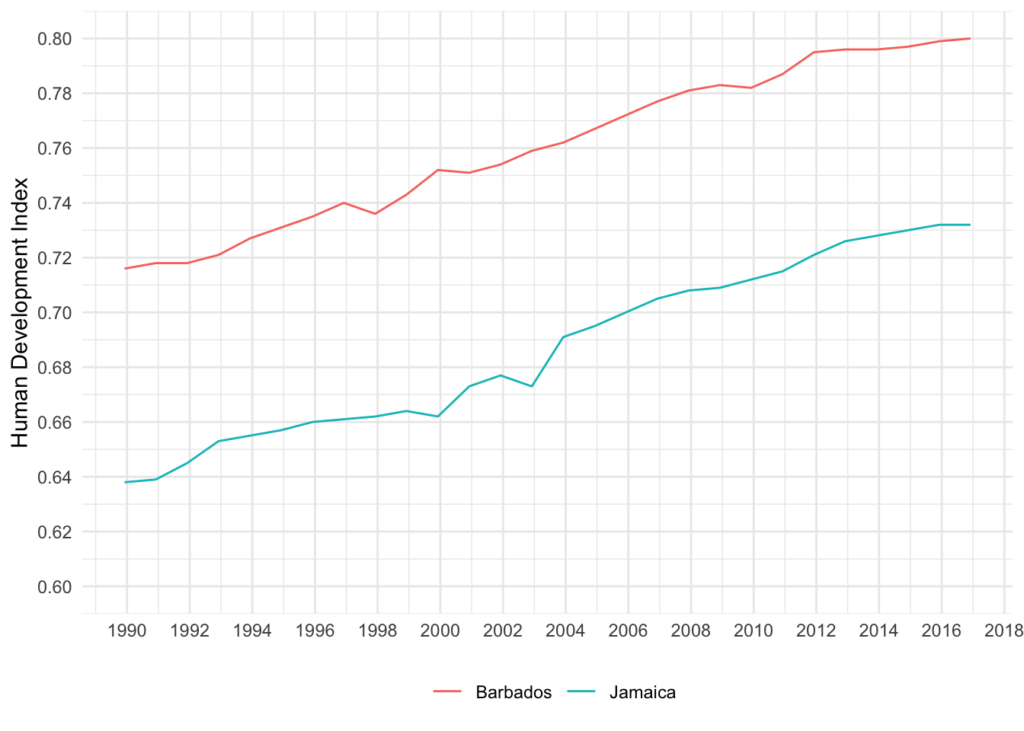
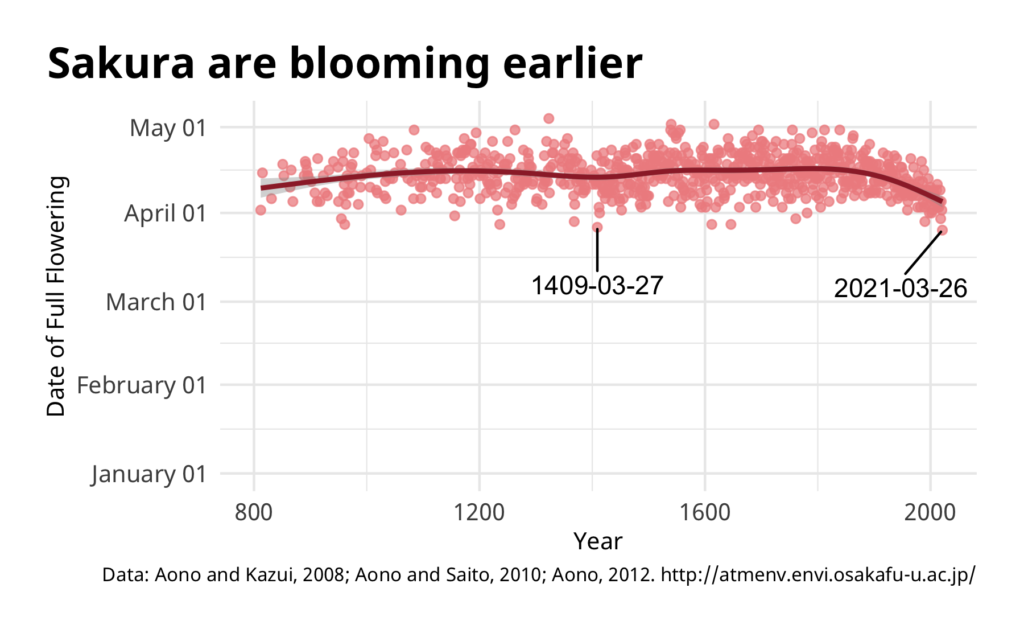
There are also a few other, smaller R projects I’ve worked on while learning R – like recreating this chart from Orlando Patterson’s The Confounding Island, or this chart showing how Cherry blossoms have been reaching peak bloom earlier– which aren’t large enough to warrant their own posts, but are cool nonetheless.
